
Ventsim™
A software suite enabling the design and simulation of underground mine and tunnel ventilation systems with controls for safe and efficient operation.
A software suite enabling the design and simulation of underground mine and tunnel ventilation systems with controls for safe and efficient operation.
Ventsim originated as mining management software in 1993. Today it ensures operations within mines and tunnels are safe and efficient. Our core team of developers are specialists in underground and open cut environments and possess unique programming skills to make sure that our software is designed to suit the demanding requirements of underground ventilation design and operation.
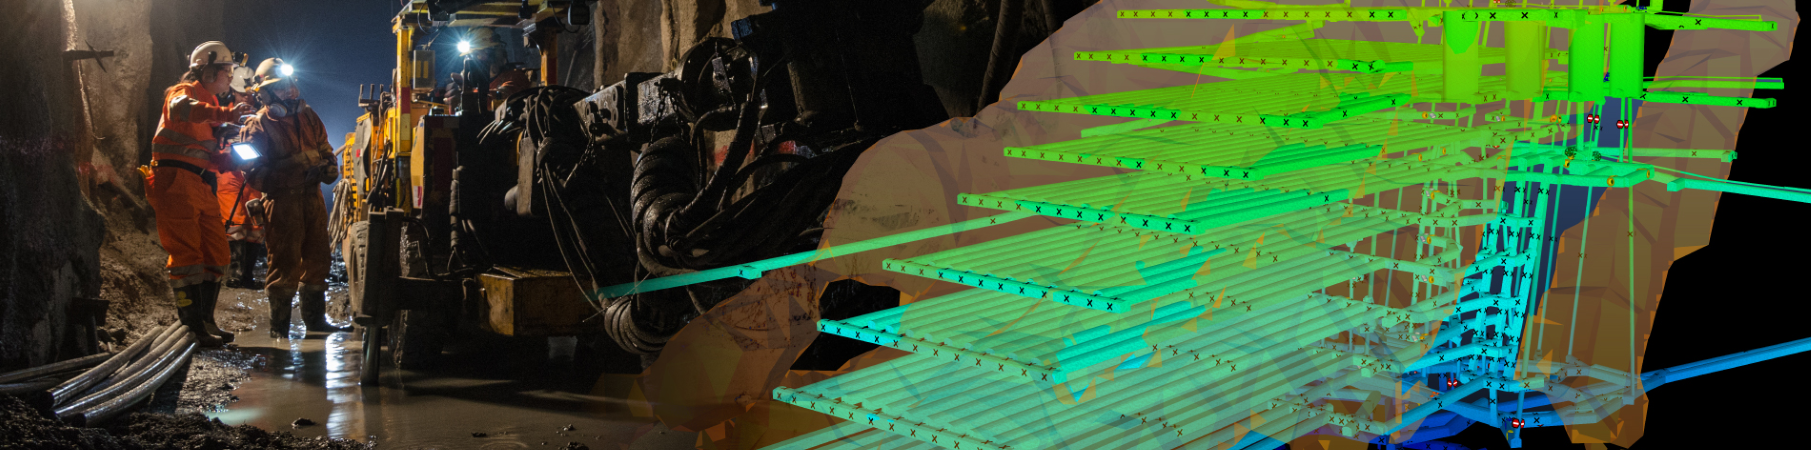
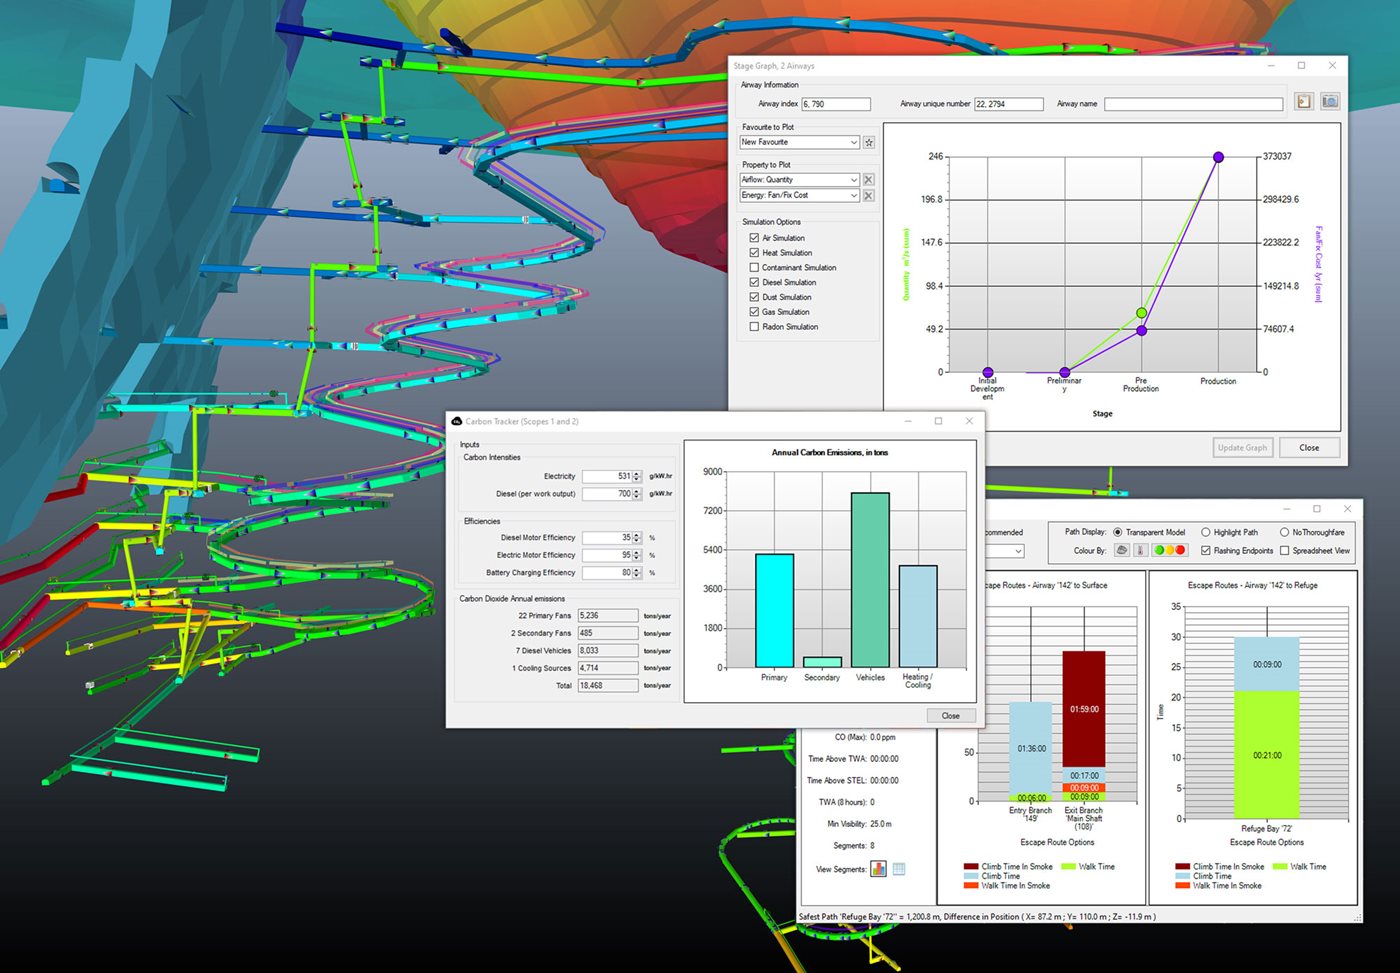
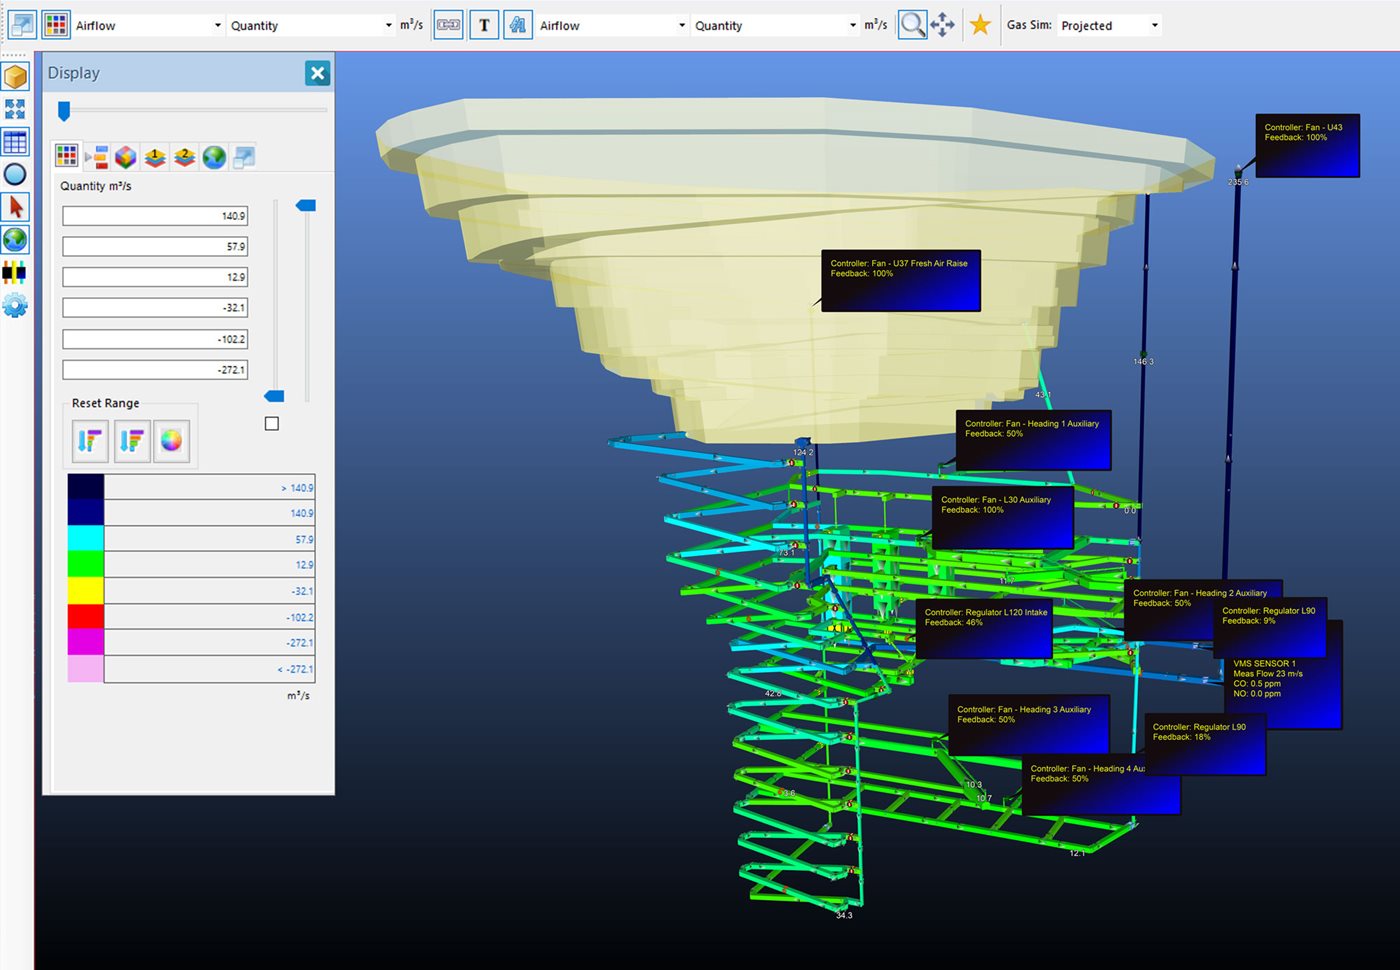
Ventsim DESIGN is a complete integrated mine and tunnel ventilation software package for the design and testing of ventilation circuits including airflow, pressure, heat, gases, power, radon, fire and many other types of ventilation information.
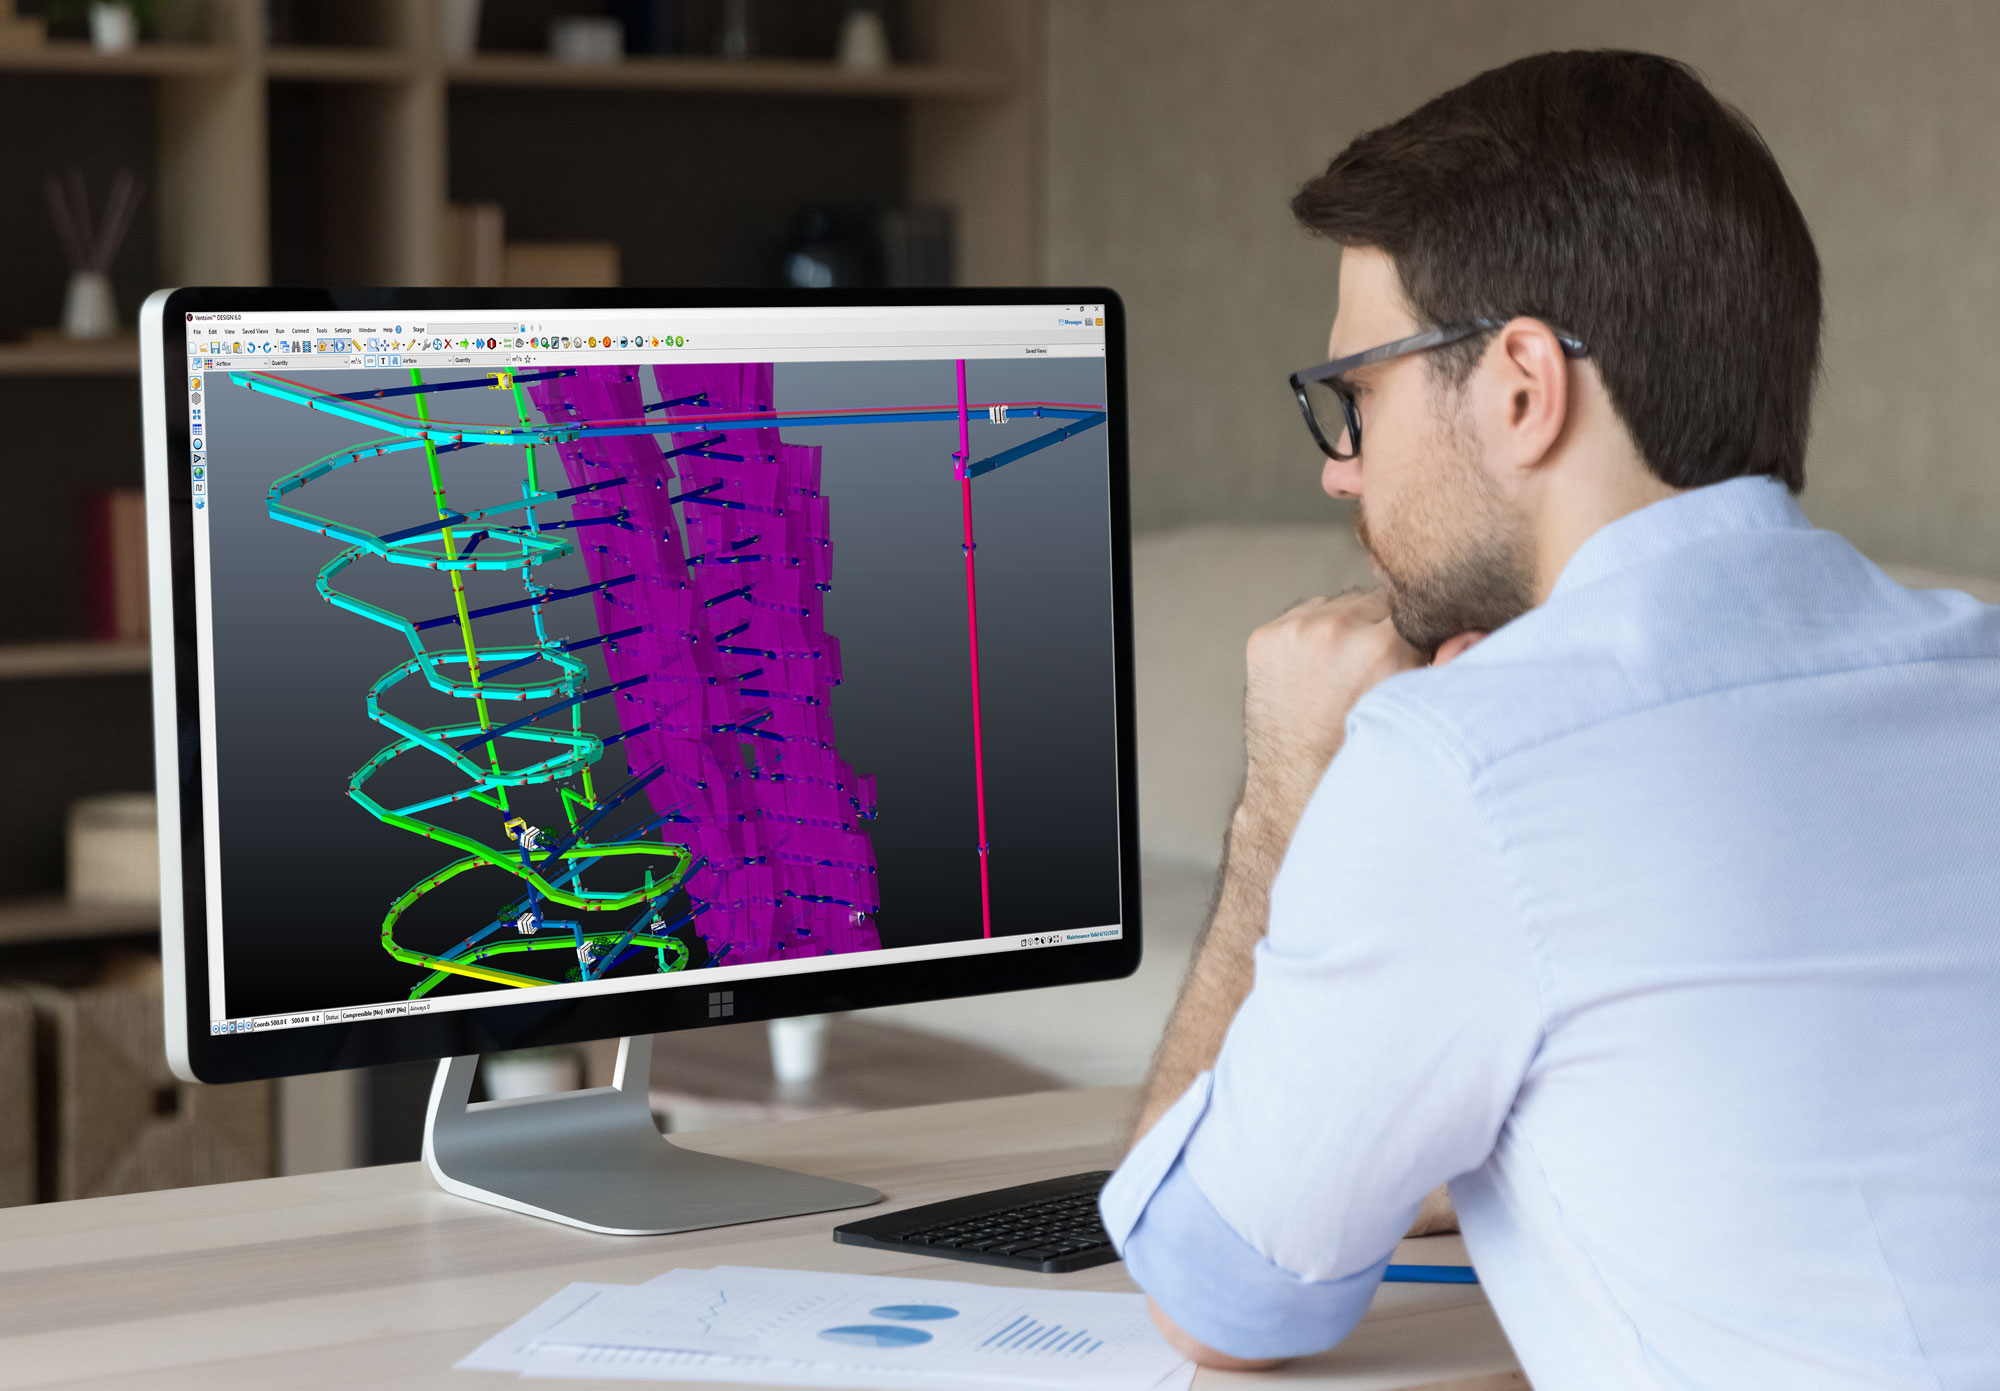
The software enables engineers to accurately model, design, evaluate, and optimize underground mine and tunnel ventilation systems by creating an accurate simulation of the ventilation environment. Real-time animated 3D graphics represent actual airway dimensions and shapes with animated airflows.
Ventsim DESIGN is an expert tool that’s useful in all stages of ventilation design, from assessing needs and selecting hardware in the early planning stages to ongoing optimization of everyday operations in a working mine or tunnel.
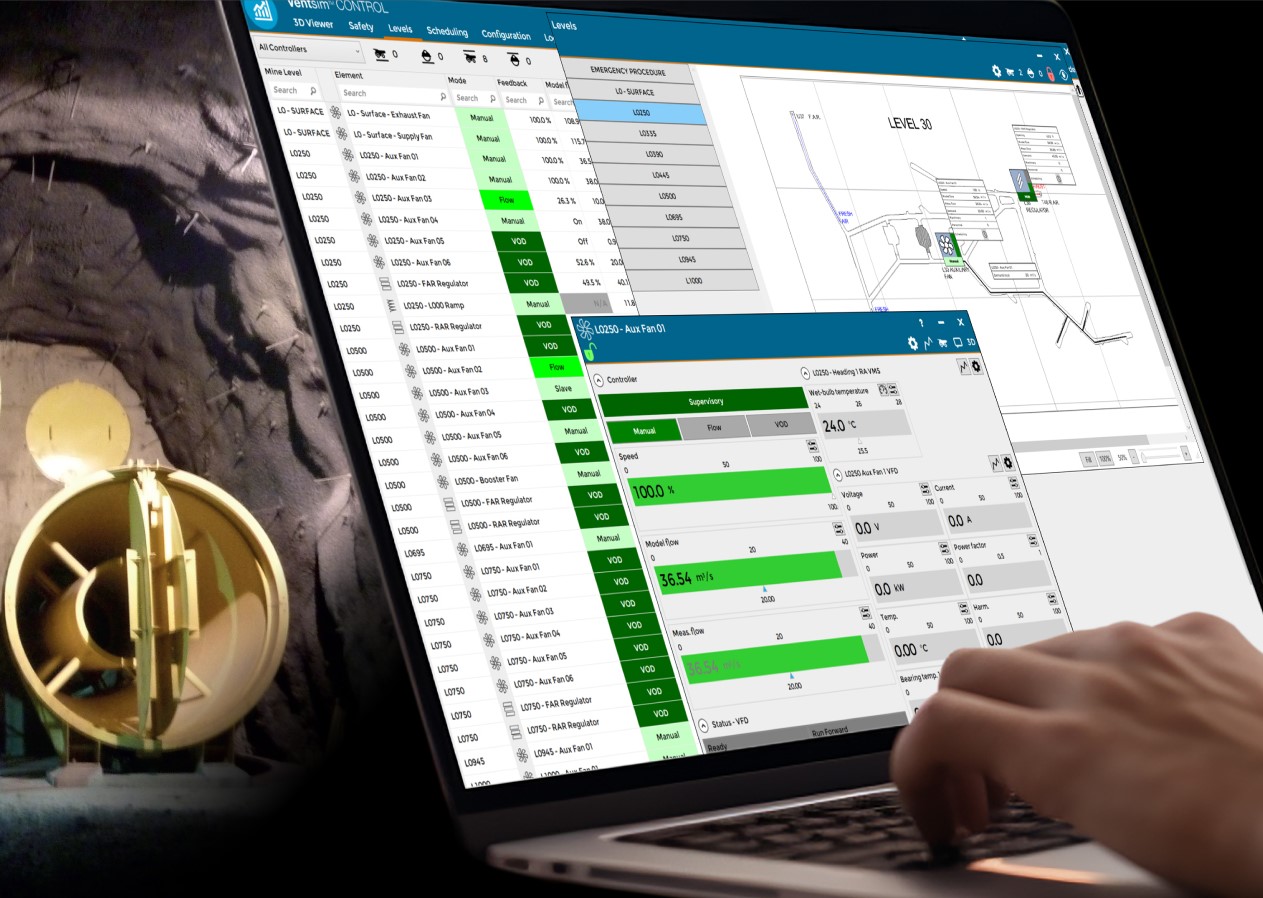
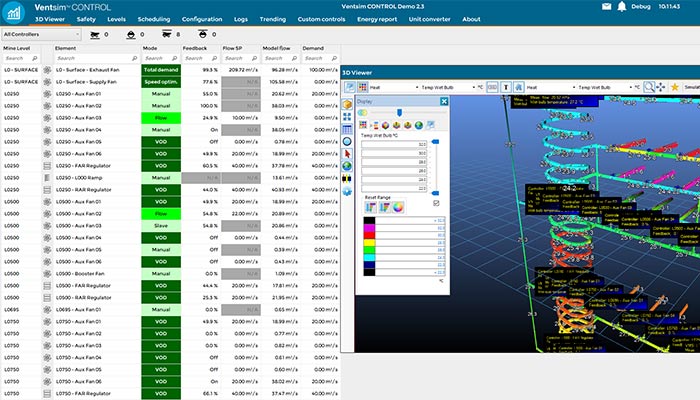
Ventsim CONTROL utilizes intelligent software connected to hardware devices to remotely monitor, control and automate airflow, heating and cooling to deliver safer, more productive and lower cost ventilation for your mine.
Ventsim CONTROL provides complete management of the ventilation system and includes an in-built energy reporting tool tracking ongoing underground ventilation energy consumption. The solution is scalable from manual remote control right up to a full Ventilation on demand (VOD) system, where the system adjusts mine airflow in real time based on vehicle and personnel position. This can be extended to include Cooling on Demand (CoD) functionality allowing users to monitor temperatures at deeper levels and push back cooled air more efficiently.
Howden mine ventilation engineers use Ventsim DESIGN simulations to create an optimized plan based on your existing mine infrastructure. Hardware and instrumentation is strategically placed in your mine model for maximum productivity based on accurate calculations of power and airflow.
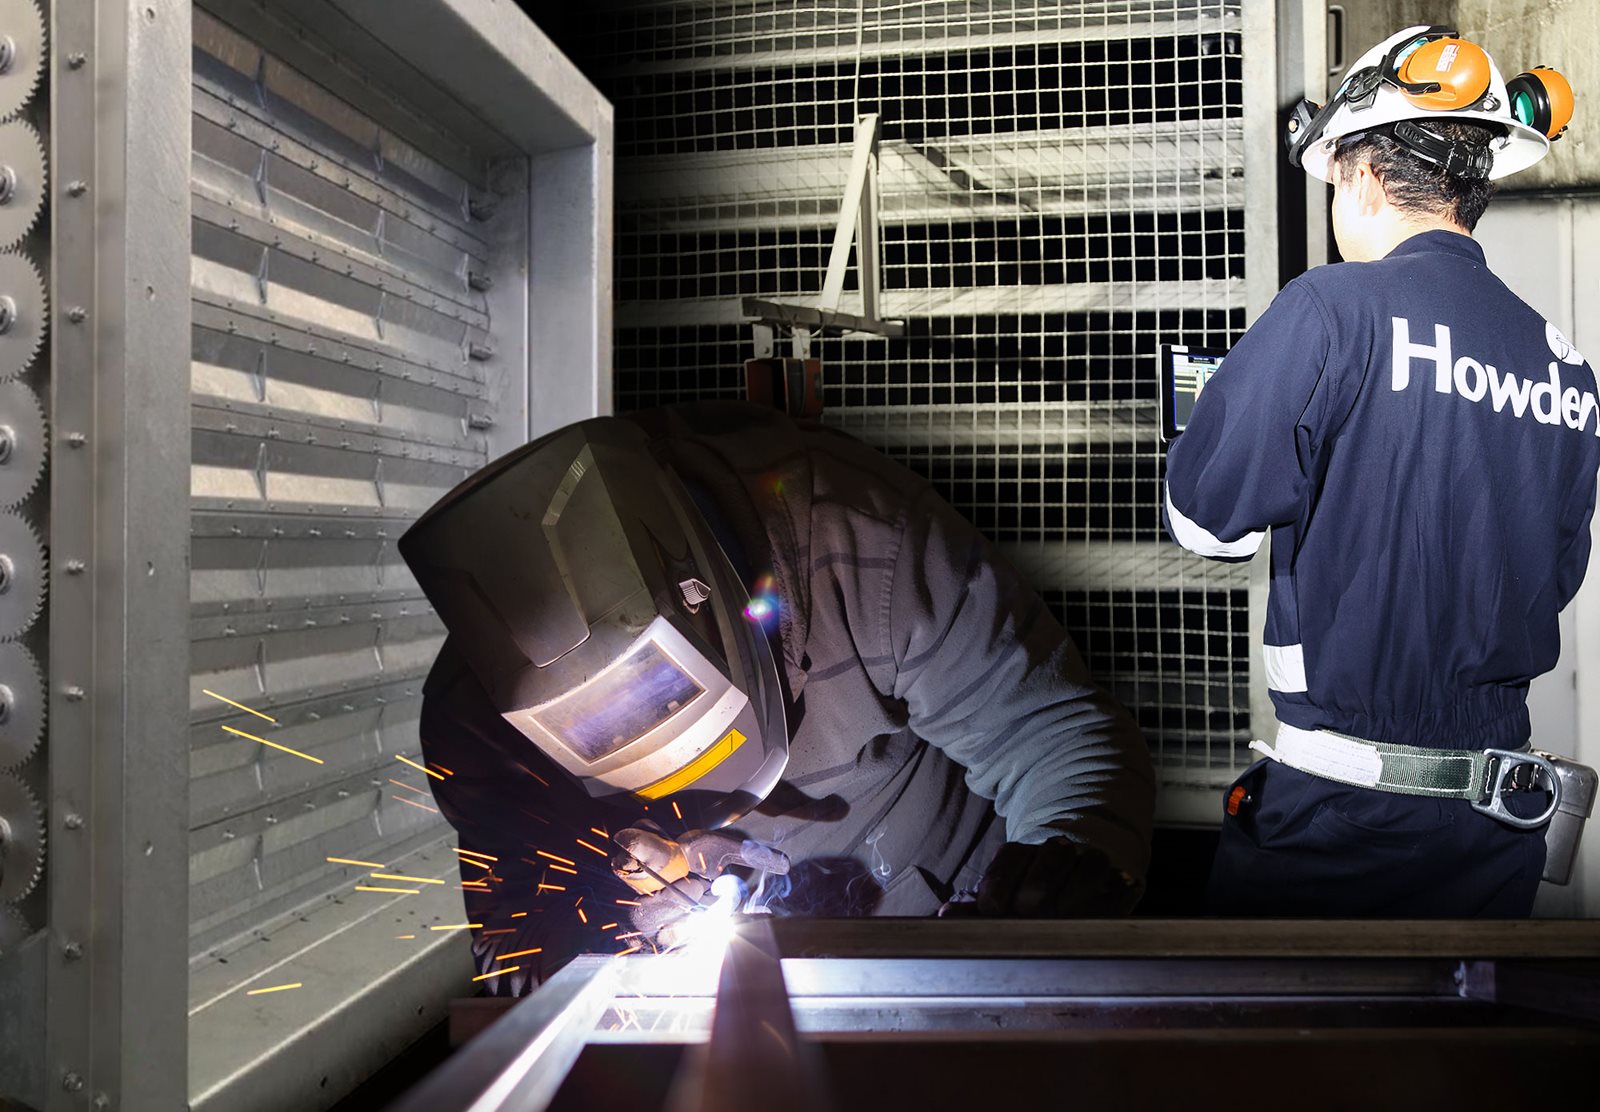
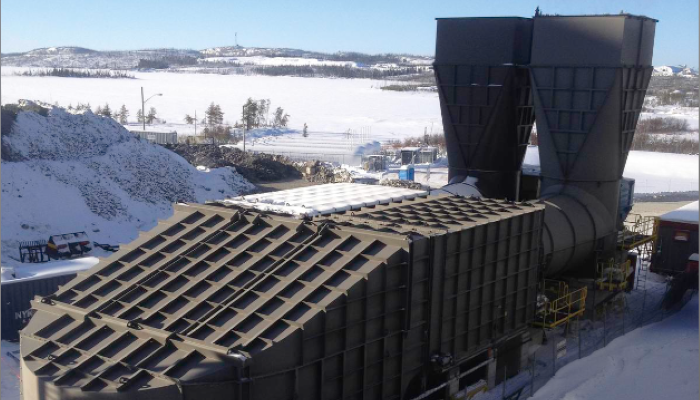
Howden airflow regulators and dampers are an integral part of Ventsim™ CONTROL Optimised Mine Ventilation Systems. Howden manufactures any size of louver-type automatic airflow regulators complete with actuators and connectors ready for MCS or MCSg control.
Ventsim DESIGN is a complete integrated mine and tunnel ventilation software package for the design and testing of ventilation circuits including airflow, pressure, heat, gases, power, radon, fire and many other types of ventilation information.
The software enables engineers to accurately model, design, evaluate, and optimize underground mine and tunnel ventilation systems by creating an accurate simulation of the ventilation environment. Real-time animated 3D graphics represent actual airway dimensions and shapes with animated airflows.
Ventsim DESIGN is an expert tool that’s useful in all stages of ventilation design, from assessing needs and selecting hardware in the early planning stages to ongoing optimization of everyday operations in a working mine or tunnel.
Ventsim CONTROL utilizes intelligent software connected to hardware devices to remotely monitor, control and automate airflow, heating and cooling to deliver safer, more productive and lower cost ventilation for your mine.
Ventsim CONTROL provides complete management of the ventilation system and includes an in-built energy reporting tool tracking ongoing underground ventilation energy consumption. The solution is scalable from manual remote control right up to a full Ventilation on demand (VOD) system, where the system adjusts mine airflow in real time based on vehicle and personnel position. This can be extended to include Cooling on Demand (CoD) functionality allowing users to monitor temperatures at deeper levels and push back cooled air more efficiently.
Howden mine ventilation engineers use Ventsim DESIGN simulations to create an optimized plan based on your existing mine infrastructure. Hardware and instrumentation is strategically placed in your mine model for maximum productivity based on accurate calculations of power and airflow.
Howden airflow regulators and dampers are an integral part of Ventsim™ CONTROL Optimised Mine Ventilation Systems. Howden manufactures any size of louver-type automatic airflow regulators complete with actuators and connectors ready for MCS or MCSg control.
Access and download literature, specifications, case studies and more.
Main Office +61 7 3733 0760
North America +1 450 923 0400
 Request A Quote
 Email An Inquiry
 Find Our Locations
 Join Our Team